A Spatial Transcriptomics Browser for Discovering Gene Expression Landscapes across Microscopic Tissue Sections
written by Maria Schmidt, Methodology, Formal analysis, Writing – original draft, Susanna Avagyan, Data curation, Writing – original draft, Kristin Reiche, Writing – original draft, Funding acquisition, Hans Binder, Conceptualization, Methodology, Writing – original draft, Funding acquisition and Henry Loeffler-Wirth, Conceptualization, Methodology, Writing – original draft
ABSTRACT
A crucial feature of life is its spatial organization and compartmentalization on the molecular, cellular, and tissue levels. Spatial transcriptomics (ST) technology has opened a new chapter of the sequencing revolution, emerging rapidly with transformative effects across biology. This technique produces extensive and complex sequencing data, raising the need for computational methods for their comprehensive analysis and interpretation. We developed the ST browser web tool for the interactive discovery of ST images, focusing on different functional aspects such as single gene expression, the expression of functional gene sets, as well as the inspection of the spatial patterns of cell–cell interactions. As a unique feature, our tool applies self-organizing map (SOM) machine learning to the ST data. Our SOM data portrayal method generates individual gene expression landscapes for each spot in the ST image, enabling its downstream analysis with high resolution. The performance of the spatial browser is demonstrated by disentangling the intra-tumoral heterogeneity of melanoma and the microarchitecture of the mouse brain. The integration of machine-learning-based SOM portrayal into an interactive ST analysis environment opens novel perspectives for the comprehensive knowledge mining of the organization and interactions of cellular ecosystems.
INTRODUCTION
Molecular diagnostics of transcriptional activity in tissue biopsies has experienced multiple technical revolutions in the last two decades. Initially, surface hybridization-based microarrays allowed for targeted profiling of more than 20,000 human genes per chip at moderate costs [1]. These were later superseded by high-throughput DNA and RNA sequencing [2], which facilitated the expression profiling and also untargeted detection of novel transcripts, depending on sequencing depth [3,4]. Both techniques require a significant amount of sample material for extraction of the desired RNA, which is provided by bulk samples, usually containing pooled populations of hundreds to millions of individual cells. This entails the problem of intermixing expression signatures, as cells from different tissues, different cell types, and potentially diseased and healthy cells are captured together by the biopsy. A further problem is the sampling bias caused by intra-tumor heterogeneity [5,6]. Emerging single-cell isolation methods overcame these issues and delivered the individual cells’ transcriptomes [7]. Hence, transcriptomics is a child of technological progress, from the microarrays that first enabled genome-scale experiments to high-throughput sequencing and, afterward, the revolution triggered by single-cell methods.
However, these dissociation-based techniques share a major drawback: the loss of spatial information, crucial for understanding tissue functionality. Recent developments in sequencing technologies overcame this gap by resolving the spatial information of transcriptomes on a microscopic scale [8]. For example, the Visium spatial transcriptomics (ST) technique uses sequencing and localization barcoding [9] to analyze elementary spatial units of about 55 μm in diameter, called ‘spots’. Each spot contains a few (up to about a dozen) cells enabling a sort of ST microscopy (Greek ‘mikros’—small—and ‘skopeo’—look at [10]).
The field of ST is now developing rapidly, with a potentially transformative effect across many areas of biology [11]. Spatial resolution will be vital for scientific questions such as understanding the complex ecosystem of the tumor microenvironment (TME), or the cellular architecture of organismal development and the resulting microanatomy of complex healthy tissues such as the brain. The wet lab technologies that produce big (i.e., very large and complex) sequencing data urgently require computational methods for their comprehensive analysis and interpretation. Single-cell sequencing previously led to an explosion of computational tools, ranging from adaptations of bulk omics methods to inventions of novel machine learning approaches for pseudotime and RNA velocity analyses. Now, the spatial field is similarly poised for a period of rapid and exciting progress in bioinformatics and systems biology [12].
So far, the development of computational methods for spatial omics has focused on preprocessing, read mapping, and quality control tasks, facilitated by tools such as Space Ranger [13], ST Pipeline [14], or SnapATAC [15]. Next-step tools like Seurat [16], BayesSpace [17], and SpaGCN [18] accomplish class discovery tasks, providing insights into cell types and cellular subpopulations. Other questions, such as spatially-variable gene identification, benefit from tools like SpatialDE [19], trendsceek [20], and SPARK [21], with each offering unique strategies for pinpointing genes with distinct spatial expression patterns. Further tools like CARD [22], Tangram [23], SpaGE [24], GCNG [25], SpaOTsc [26], MULTILAYER [27], stLearn [28], SpaRx [29], SiGra [30], and SpatialData [31] address diverse issues ranging from cell-type deconvolution in the capture spots to the exploration of cell–cell interactions, and also support region annotation, drug response, and spatial trajectory analyses. These tools collectively provide a first (by far not complete) set of bioinformatics tools enhancing our understanding of spatial transcriptomics data. Recent reviews provide a wide overview of the state of the art of the field (see [8,32,33,34] and references cited therein).
Traditional optical microscopy requires ‘skopus’ functionalities to ‘look at’ the specimen, i.e., its detailed visual inspection, usually through its eyepiece, enabling active manipulations such as shifting and zooming the inspected region of the microscopic slide. This process often incorporates a variety of histochemical staining, e.g., for pathological inspections. In ST, such ‘skopus’ tasks are accomplished computationally and have the need for versatile platforms, advanced data exploration capabilities, user-friendly interfaces, and knowledge mining of spatial information, such as that provided partly by the ‘Loupe Browser’ [35] for 10x Genomics data.
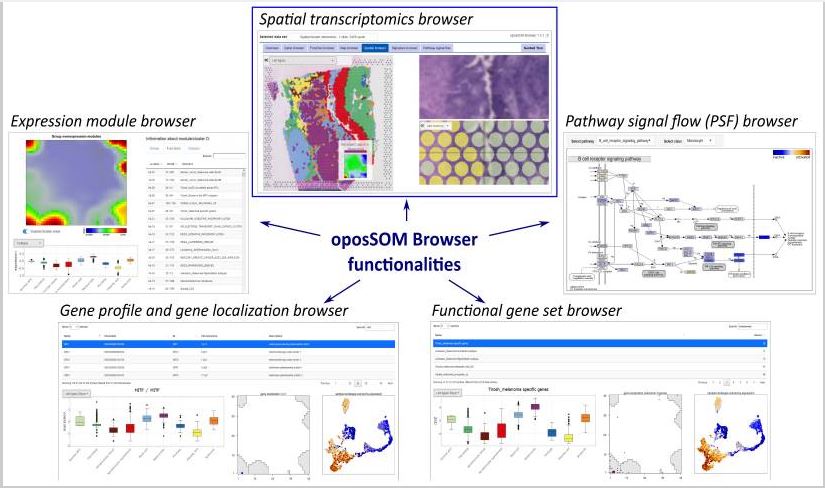
We here present a newly developed ST web tool, designed for the interactive discovery of ST images under various functional aspects. A central novel feature that makes our tool unique is the application of self-organizing map (SOM) machine learning to ST data, which generates individual expression portraits for each of the spots in the ST image, enabling combined ‘skopus’ tasks in the transcriptome landscape and the ST image as well. These portraits provide detailed information about the local expression landscape with individual spot resolution in an easily perceivable and interpretable fashion. Our browser enables users to investigate single gene expression by selecting any of the more than ten thousand genes in the dataset, explore the expression of functional gene signatures by selecting them from a repository of a few thousand gene sets implemented in the tool, as well as inspect the joint expression of receptor–ligand pairs to study the spatial patterns of cell–cell interactions.
The method of data portrayal through SOMs has been previously developed for dimension and redundancy reduction in multidimensional omics data [36], making use of the algorithm of Kohonen maps [37]. It was previously applied by us to a wide spectrum of bulk omics and single-cell data using genetic, transcriptomic, and epigenetic data, and to their integrative multi-omics analysis (see, e.g., [38,39,40,41,42]). The method has been proven effective for the modularization and functional interpretation of cellular programs and, as its specific feature, enables an easily perceivable and interpretable visualization of granular data landscapes [43]. Our ST application makes use of the previously developed ‘oposSOM’ software (version 2.4) [44]. The ST browser is offered as a novel extension of the oposSOM-Browser [45] developed for bulk and single-cell omics data. In this publication, we describe the functionality of the spatial browser in the context of two use cases, addressing in detail the intra-tumoral heterogeneity of melanoma and, as an illustration, the cellular architecture of the mouse brain. We focus on the application aspects and on biological knowledge mining at the gene and cell levels to illustrate the association between spatial and functional aspects for the two selected use cases.
. . .
CONCLUSIONS
The interactive ST SOM browser provides a new bioinformatics resource to study the spatial architecture of diseased and healthy tissues with gene transcript and cellular resolutions. It enables knowledge mining in the sense of the ‘skopus’, i.e., the ‘look at’ functionality, of microscopic images based on the expression of nearly twenty thousand genes varying across the image and serving as markers for cell types and their varying transcriptional programs. The use cases demonstrate that the detailed look-at option will allow a better understanding of intra-tumoral heterogeneity in solid tumors. The ST patterns of the mouse brain illustrate a use case related to the microanatomy of healthy tissues, which will soon be extended by novel ST data of the sebaceous gland available in the browser. Future addition of spatial transcriptomics samples will eventually enable healthy and diseased tissues, or different samples of the same tumors, to be directly compared.
to read the full article, click here: https://www.ncbi.nlm.nih.gov/pmc/articles/PMC11119626/