AI-based medical image processing and tissue modeling for clinical application
Dr. Höhme research group
.
In recent years, the relevance and prospects of AI-based systems in medicine has increased rapidly.
Their ability to extract, analyse, correlate and integrate various experimental and clinical data
modalities now allows to address novel clinical questions, better understand disease and improve
treatment.
Our research group has extensive experience in processing and quantification of biomedical image
data (histology, 2D/3D confocal micrographs, two-photon time series, MRI, CT) and the construction
of leading spatio-temporal 3D liver tissue models. We are currently preparing clinical translation of AIbased methods for example by development of multi-modal clinical decision support systems (CDSS)
in collaboration with several University Hospitals in Germany. The offered position will be a part of this
endeavour.
We are looking for a highly motivated person with a Master degree in computer science, physics,
mathematics or a similar field for a PhD / PostDoc position (TV-L E13) starting at July 1st 2024. Previous
experience in the AI field is not required but advantageous. Master students can complete a PhD.
PostDocs are very welcome to apply. Part-time and home-office days are possible. The position will be
co-located at the Interdisciplinary Centre for Bioinformatics (IZBI) and Centre for Scalable Data
Analytics and Artificial Intelligence (ScaDS.AI) in Leipzig.
Contact: hoehme@uni-leipzig.de
.
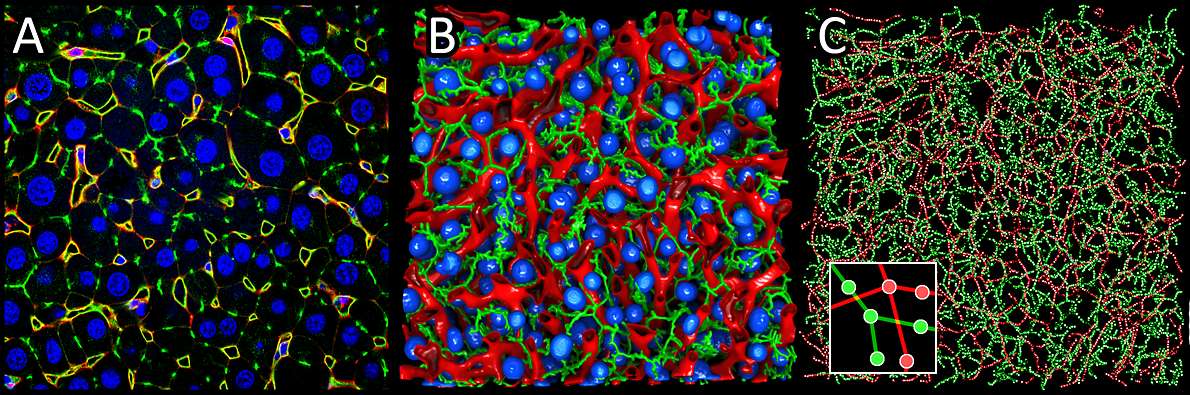
llustration of liver tissue reconstruction and quantification based on typical confocal microscopy.
A: Original data. 2D section through liver tissue stained with DAPI (blue), DPPIV (green) and DM (red).
B: Corresponding 3D segmentation of cell nuclei (blue), sinusoids (red) and bile ducts (green). C: Graphical
representation of the sinusoidal (red) and bile duct (green) networks extracted from (B), which were used,
among other things, to quantify the tissue. The inset illustrates the structure of the graph.

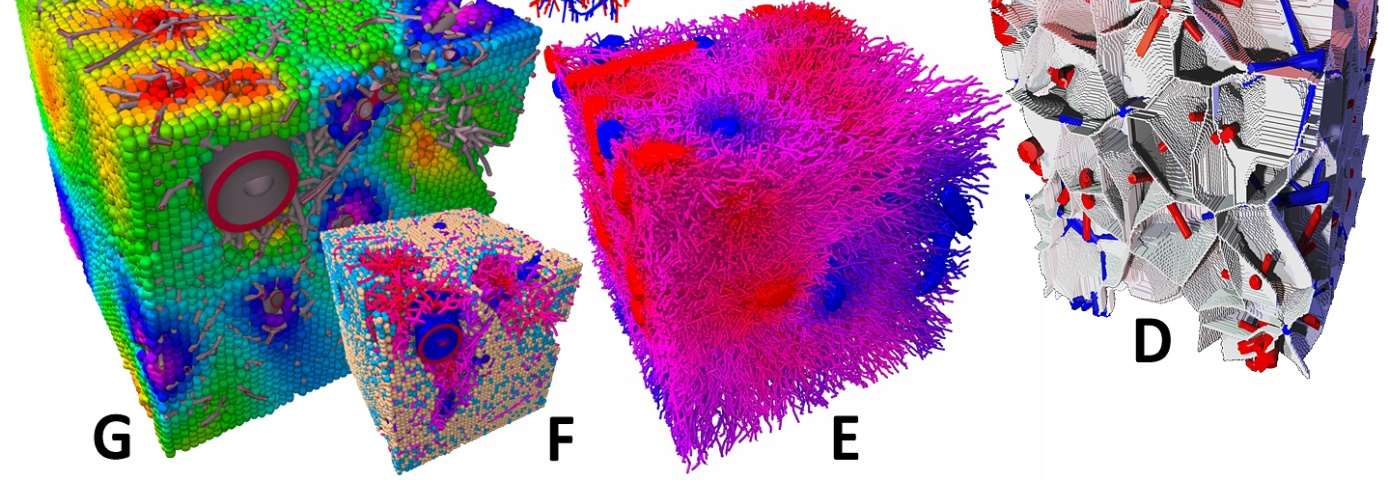
Illustration of the liver multiscale model. A: Typical CT data set (Fraunhofer MEVIS) of a liver,
B: Reconstruction of the hepatic veins and arteries from (A), C: Cubic model region extracted from (B).
D: Reconstructed liver lobule boundaries (white) based on (C), E: Sinusoidal blood vessel network (colour
denotes oxygen content: blue=high, red=low) in (D), F/G: Exemplary modelling. F: Proliferation during
regeneration (blue cells = proliferation), G: HGF concentration in (F): red=high, blue=low.